1042 . Cubist Artwork
Description
International Center for Picassonian Cubism is a Spanish national museum of cubist artworks,
dedicated to Pablo Picasso. The center held a competition for an artwork that will be displayed
in front of the facade of the museum building. The artwork is a collection of cubes that are
piled up on the ground and is intended to amuse visitors, who will be curious how the shape of
the collection of cubes changes when it is seen from the front and the sides.
The artwork is a collection of cubes with edges of one foot long and is built on a flat ground
that is divided into a grid of one foot by one foot squares. Due to some technical reasons, cubes
of the artwork must be either put on the ground, fitting into a unit square in the grid, or put
on another cube in the way that the bottom face of the upper cube exactly meets the top face
of the lower cube. No other way of putting cubes is possible.
You are a member of the judging committee responsible for selecting one out of a plenty of
artwork proposals submitted to the competition. The decision is made primarily based on
artistic quality but the cost for installing the artwork is another important factor. Your task is
to investigate the installation cost for each proposal. The cost is proportional to the number of
cubes, so you have to figure out the minimum number of cubes needed for installation.
Each design proposal of an artwork consists of the front view and the side view (the view seen
from the right-hand side), as shown in Figure 1.
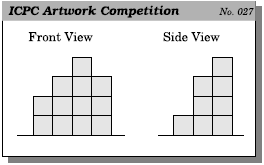
Figure 1: An example of an artwork proposal
The front view (resp., the side view) indicates the maximum heights of piles of cubes for each
column line (resp., row line) of the grid.
There are several ways to install this proposal of artwork, such as the following figures.
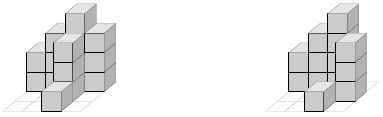
In these figures, the dotted lines on the ground indicate the grid lines. The left figure makes use
of 16 cubes, which is not optimal. That is, the artwork can be installed with a fewer number
of cubes. Actually, the right one is optimal and only uses 13 cubes. Note that, a single pile of
height three in the right figure plays the roles of two such piles in the left one.
Notice that swapping columns of cubes does not change the side view. Similarly, swapping
rows does not change the front view. Thus, such swaps do not change the costs of building the
artworks.
For example, consider the artwork proposal given in Figure 2.
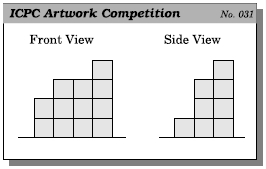
Figure 2: Another example of artwork proposal
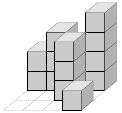
An optimal installation of this proposal of artwork can be achieved with 13 cubes, as shown
in the following figure, which can be obtained by exchanging the rightmost two columns of the
optimal installation of the artwork of Figure 1.
Input Format
The input is a sequence of datasets. The end of the input is indicated by a line containing two
zeros separated by a space. Each dataset is formatted as follows.
w d
h1 h2 ... hw
h'1 h'2 ... h'd
The integers w and d separated by a space are the numbers of columns and rows of the grid,
respectively. You may assume 1 ≤ w ≤ 10 and 1 ≤ d ≤ 10. The integers separated by a space
in the second and third lines specify the shape of the artwork. The integers hi (1 ≤ hi ≤ 20,
1 ≤ i ≤ w) in the second line give the front view, i.e., the maximum heights of cubes per each
column line, ordered from left to right (seen from the front). The integers h'i (1 ≤ h0i ≤ 20,
1 ≤ i ≤ d) in the third line give the side view, i.e., the maximum heights of cubes per each row
line, ordered from left to right (seen from the right-hand side).
Output Format
For each dataset, output a line containing the minimum number of cubes. The output should
not contain any other extra characters.
You can assume that, for each dataset, there is at least one way to install the artwork.
Sample Input 1
5 5
1 2 3 4 5
1 2 3 4 5
5 5
2 5 4 1 3
4 1 5 3 2
5 5
1 2 3 4 5
3 3 3 4 5
3 3
7 7 7
7 7 7
3 3
4 4 4
4 3 4
4 3
4 2 2 4
4 2 1
4 4
2 8 8 8
2 3 8 3
10 10
9 9 9 9 9 9 9 9 9 9
9 9 9 9 9 9 9 9 9 9
10 9
20 1 20 20 20 20 20 18 20 20
20 20 20 20 7 20 20 20 20
0 0
Sample Output 1
15
15
21
21
15
13
32
90
186
Hints
Problem Source
Migrated from old NTUJ.
Tokyo Regional 2009
Subtasks
| No. | Testdata Range | Score |
|---|