1606 . Ants
Description
There are a group of ants living on a large grassland. The grassland can be considered as a plane with Cartesian coordinate with the ant's nest at the origin (0,0).
Every morning, the Ant Control Managing Institute - Circular Patrolling Council (in short, ACMICPC) would give every ant a distinct coordinate (x,y) (0<y<= 109, |x|<= 109), which determines the area that this ant should patrol today by the way described in the following paragraph.
When an ant gets the order, it has to walk along the circle centering at the given coordinate and start from the ant's nest. When the ant gets back to the nest, it has completed its daily order. We define an ant's "patrolling area" as the boundary and also the interior of the route it has walked.
Pipi is the head of the ACMICPC. After every ant had completed their daily order, Pipi has to make sure that everyone gets its job done. Pipi decided to patrol one more time by himself. Since Pipi is lazy, he wants to walk the minimum distance such that his patrolling area contains the intersection of all other ant's patrolling area. Pipi can walk in any shape.
When Pipi is patrolling, he realized that everyone leaves small footprint on the grassland, and each ant has a slightly different footprint! Since patrolling is boring, Pipi starts counting the number of distinct footprints he have seen. But since Pipi is bad at counting, he loses track quickly. Thus he asked you to solve this problem for him. Given the coordinates that each ant received from ACMICPC, how many different footprints would Pipi see?
Input Format
The input consists of multiple test cases. The first line of input contains an positive integer T (T<= 50), which denotes the number of test cases.
For each test case, the first line has one integer N (0<N<= 20000), indicating the number of ants that get order today. In the following N lines, the i-th line contains two integers xi, yi, indicating the coordinate that the i-th ant received from ACMICPC. No two ants would get the same coordinate.
Output Format
For each test case, please output the number of different footprints that Pipi would see.
Sample Input 1
2
3
-2 1
2 1
0 1
4
0 3
-2 2
-4 3
1 4
Sample Output 1
2
4
Hints
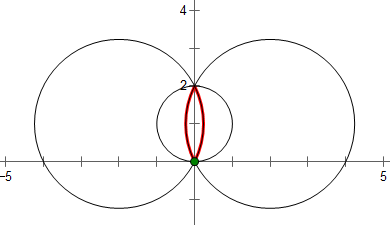
Graph for the first sample input:
Graph for the second sample input:
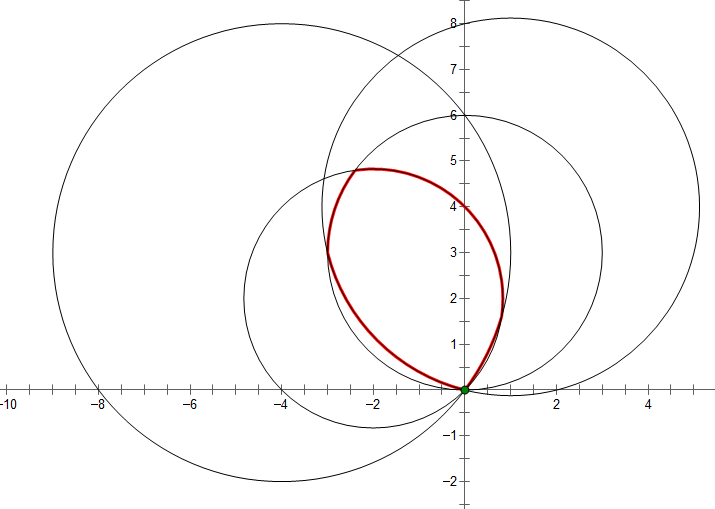
Green point is ant's nest;
black circles are the traits the other ant's walked; the red curve is the trait that Pipi walked.
Problem Source
Migrated from old NTUJ.
peter50216
Subtasks
| No. | Testdata Range | Score |
|---|